Algorithms that pinpoint power line faults
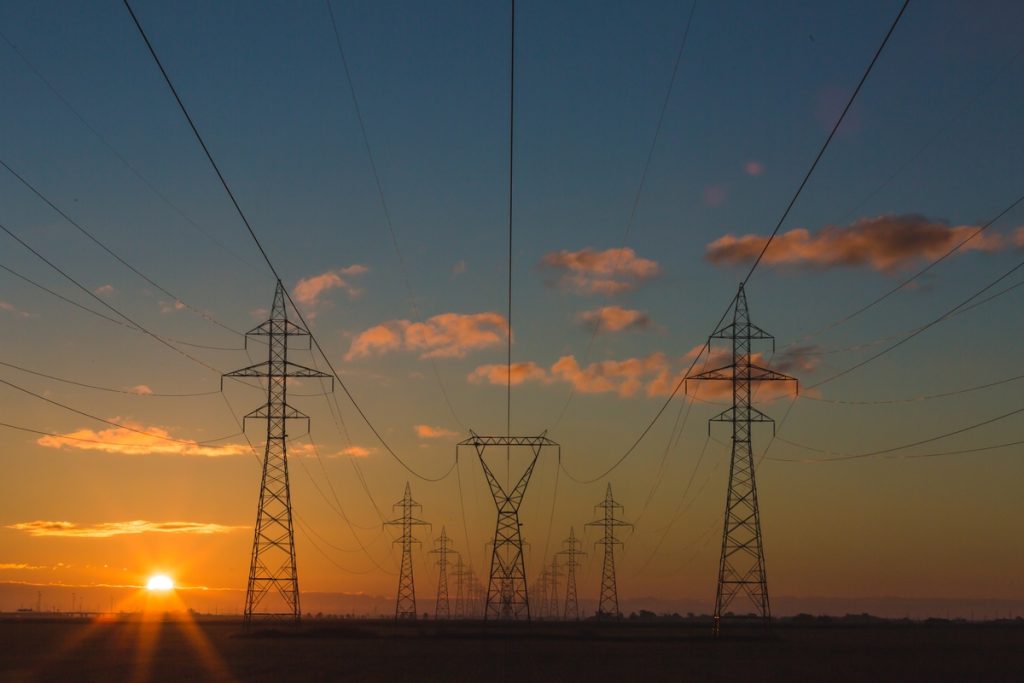
Power lines can cause destructive wildfires, but CSU statisticians are developing algorithms that can offer real-time alerts about potential faults within the grid.

The Marshall Fire erupted in Boulder County on Dec. 30, 2021, ultimately growing to more than 6,000 acres, destroying more than 1,000 buildings, and leaving two people dead – making it the most destructive wildfire in Colorado history.
Investigators now believe a sparking power line may have helped ignite the blaze, which was stoked by high winds and extremely dry conditions. This is far from the only example of power lines causing destructive fires. The 2022 Dixie Fire, the second-largest in California history, was ignited when power lines came in contact with a tree. The 2018 Camp Fire, which killed 85 people near the town of Paradise, California, was sparked by failing transmission lines.
The question: Is it possible to predict when these power lines will fail? And if that’s not possible, how soon can the proper authorities determine that there’s been a fault within the grid and where it happened? Colorado State University statistics Professor Piotr Kokoszka and his department Chair Haonan Wang are hoping to provide a solution to this problem by developing algorithms that can parse through the complex data generated by the power network and offer real-time alerts about potential faults.
“If a power line goes down, you can see the aftermath across the whole network in fractions of a second,” Kokoszka said. “The difficult part is finding where it happened because the consequences are everywhere. If you look at the graphs, the disruptions look basically the same in Phoenix as they do in Vancouver.”
A big part of what makes this research so difficult is the sheer scale. Kokoszka’s team is focusing on the Western Interconnection, a grid that stitches together all the electric utilities from the California coast to the Great Plains, stretching from western Canada south to Baja California in Mexico, ultimately serving 80 million customers through approximately 136,000 miles of transmission lines that crisscross remote areas in a wide variety of landscapes.
Relatively cheap devices called phaser measurement units can monitor the output of these lines up to 120 times per second, but they add another layer of complexity in that it’s not feasible for them to be placed in as many places as they ideally should be.
“Another aspect we study is, say, you want to monitor the network, but you can’t put these devices everywhere,” Kokoszka said. “We developed an algorithm that uses deep learning that essentially determines where these devices should be placed to provide optimal fault localization.”
Meanwhile, Kokoszka said power doesn’t just flow in a single direction like it did 30 years ago. Today, more users than ever can generate their own solar electricity, creating bidirectional flows and an even more complicated pattern for those trying to decipher the data coming from the electrical grid.
“That’s why the statistics and mathematics community is involved,” Kokoszka said. “Imagine you have zillions of data points per second from hundreds of locations and multiple variables. Without an algorithm, it’s hard to make sense of this in any meaningful way.”
This CSU research is funded by an ongoing grant from the National Science Foundation. Kokoszka and Wang are working alongside researchers from the University of Wyoming and the National Renewable Energy Laboratory. The hope is that the new algorithms can be used by other researchers studying power line faults, and eventually utility companies themselves.
“If there is a fault, the algorithm can signal the fault – and hopefully pinpoint where it occurred,” Kokoszka said. “Now, this is statistics; things are not perfect. But if we correctly localize a fault with more than 95% probability, it can be a huge help in terms of response.”


